Nowadays you can’t win much in rugby if you’re proficient in one aspect of the game only, be it offense or defense. You’ve got to bring your “A” game when getting closer to the opponents 22 and at the same time defend in full strength from the second you lose the ball. Attacking is nothing without defense, and vice-versa. Analysing attack and defense of a player and of a team is, however, very hard unless you have strong data to support you. Therefore, using all the data available on the most common statistics I have compared the performance between each player and each team to elect the best defender and the best attacker. Who does the two things best, and why?

Defensive stats
Modern rugby is dynamic, physical. It gives you little time to think. Apart from scrum halves crouching behind a ruck, players that hesitate on the field get tackled without hesitation before they can say “blueberry pie“. The ability to tackle, and to do it effectively, is now more than ever an essential skill even for bottom-ranking teams if they want to avoid colossal embarrassments. I hope the old glories of rugby will forgive me when I say that when I see a match from the 80s or 90s, aside from its obvious nostalgic charm, the difference in rhythm and physicality is quite noticeable. Therefore, it becomes essential to understand which players are most capable of tackling effectively, without conceding penalties to the other team.
Tackling
I gathered the tackle statistics from each player in each team and selected only those players who had played at least 4 out of 16 games (25% of the season games). This may seem permissive, but I’ll give you an example: Johnny Sexton has played exactly 4 games this year, 2 of which as a starter only. If I had to analyse the most effective fly halves, however, I would like him to be included in the calculation. Hence, at least 4 games seemed a good criterion to me. I then extracted the number of tackles per game played, the missed tackles per game, and the tackle success rate. Here are the five players with the best values:
| Player | Club | Role | Games | Tackles/game | Missed | Success |
|---|---|---|---|---|---|---|
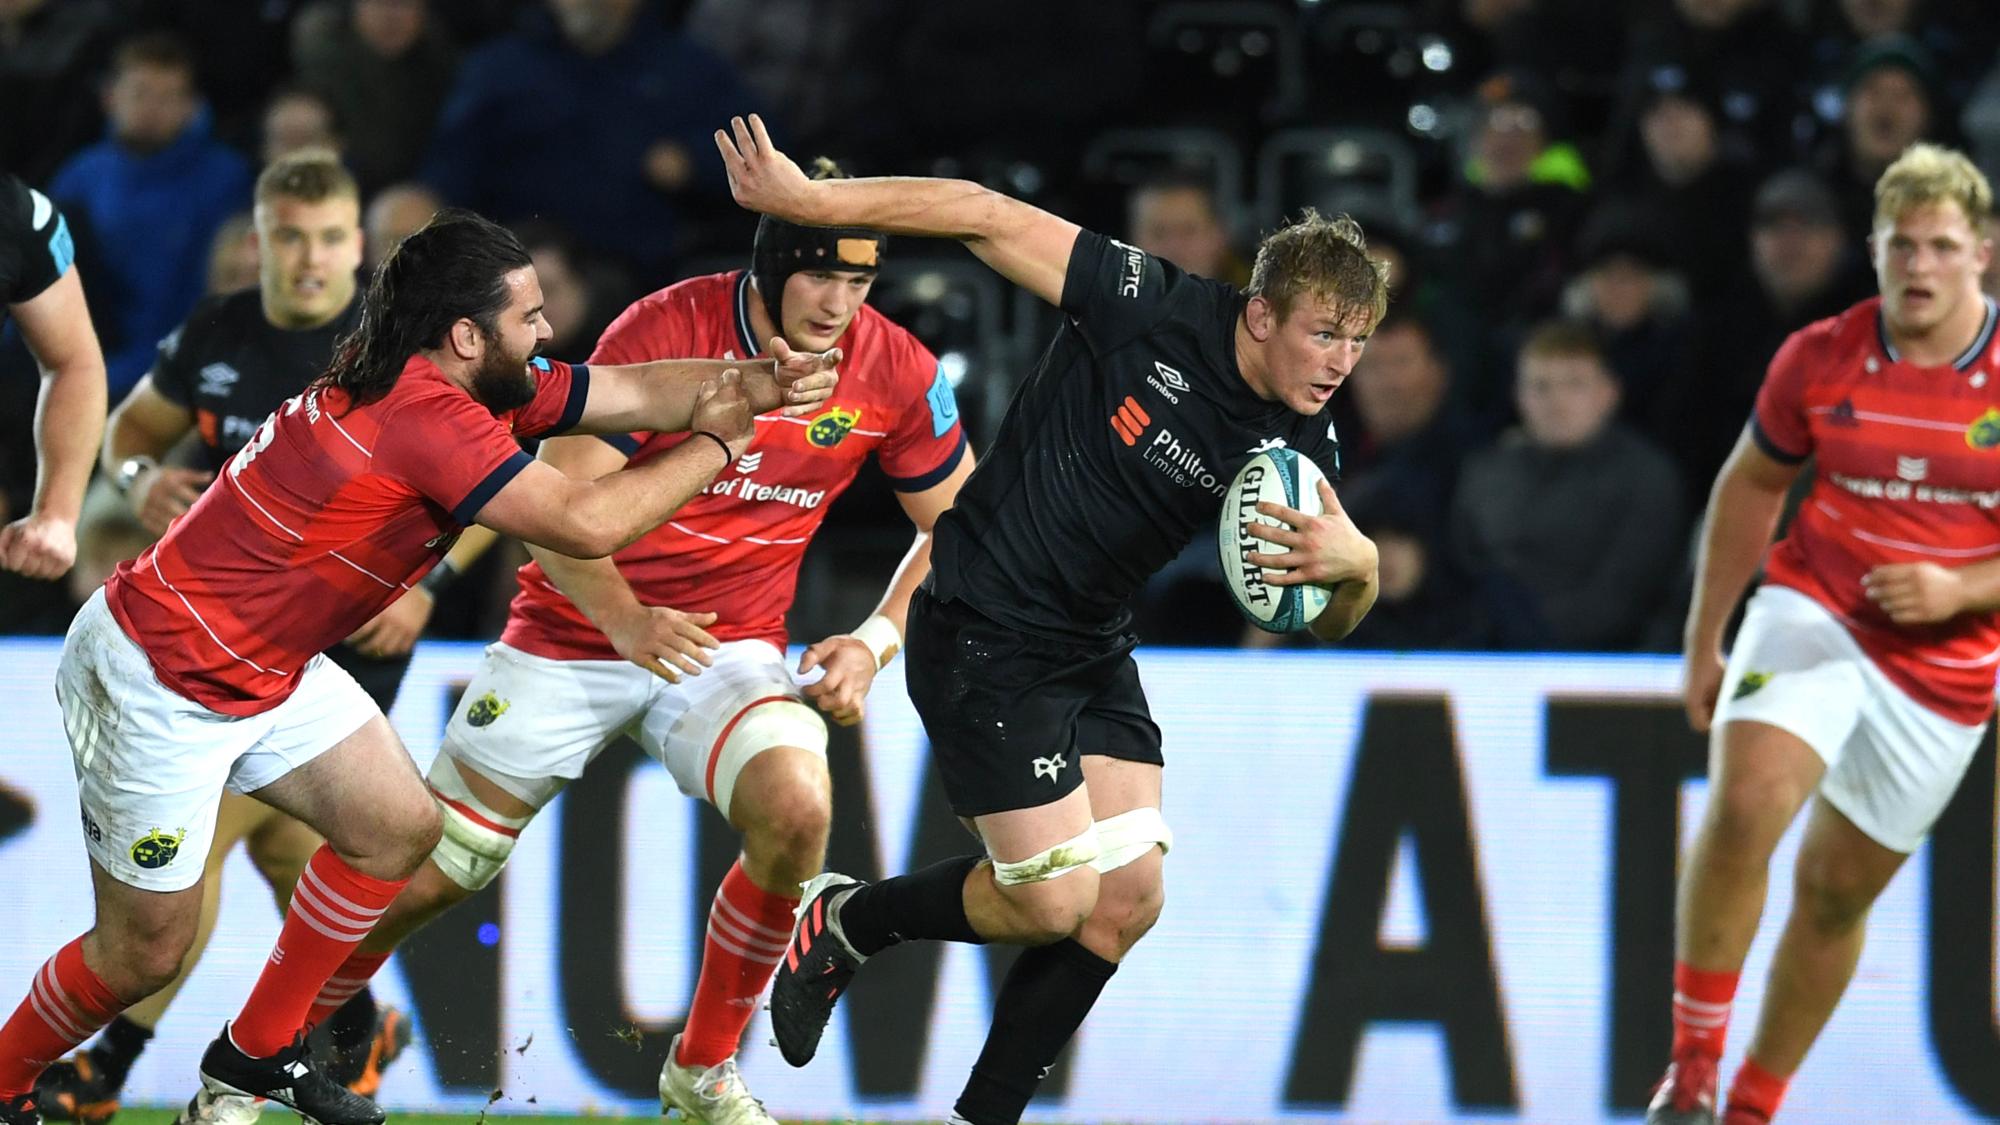
| Jac Morgan | Ospreys | Flanker | 13 | 15.2 | 1.1 | 93 % |
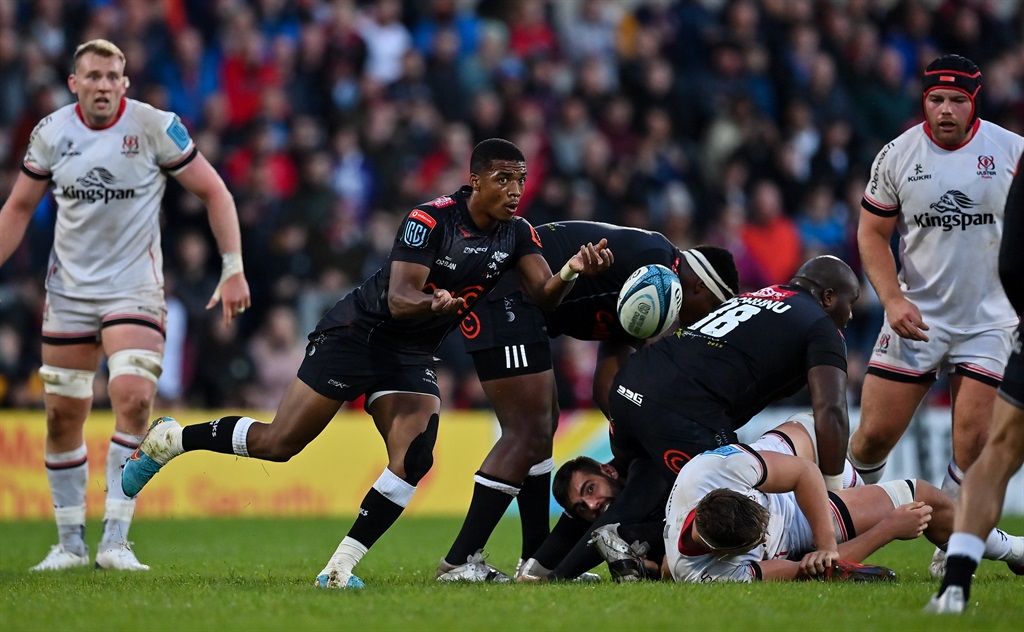
| Nick Timoney | Ulster | No. 8 | 18 | 15.2 | 0.8 | 93 % |
| Willie Engelbrecht | Stormers | No. 8 | 5 | 14.2 | 1.6 | 87 % |
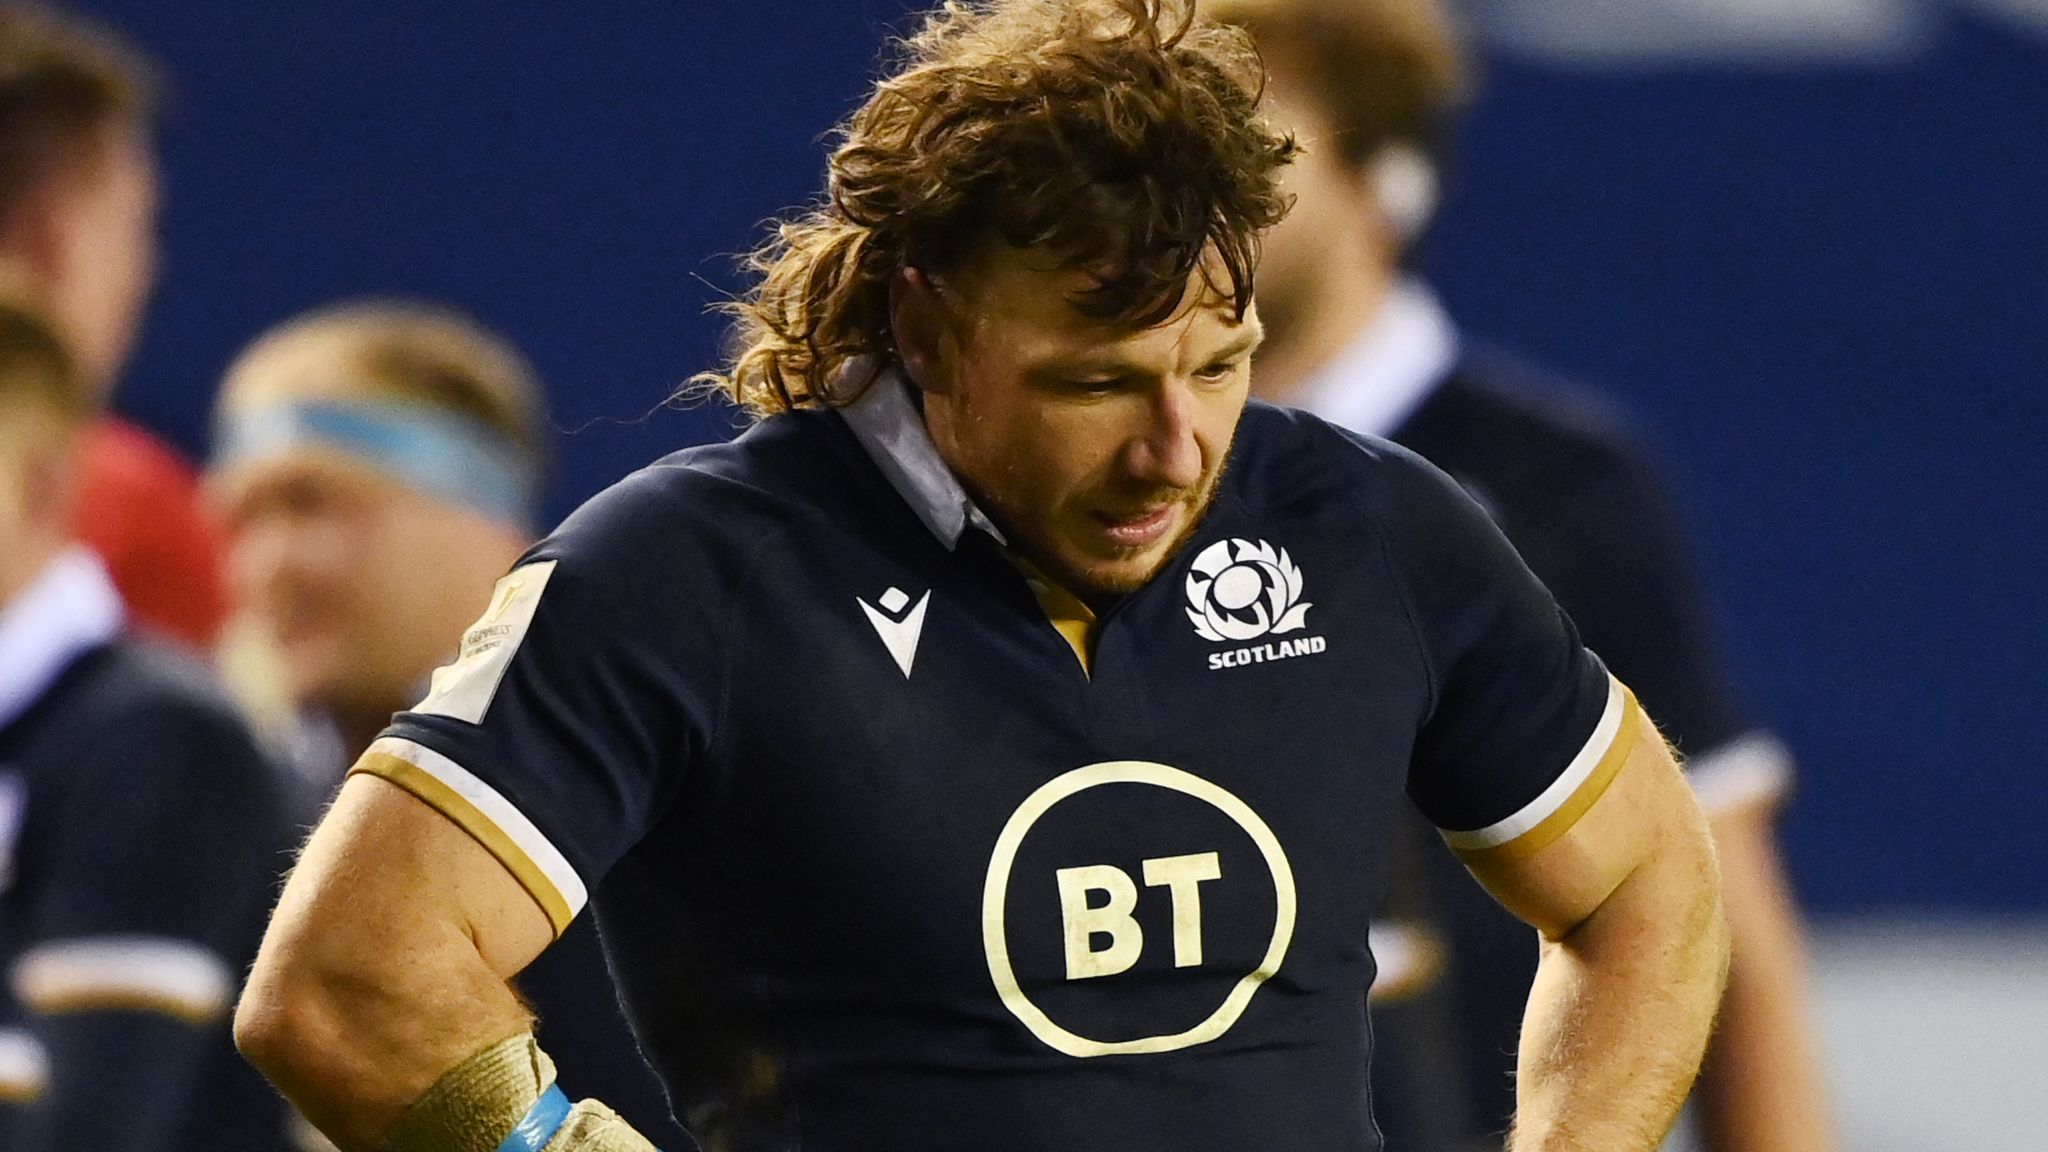
| Hamish Watson | Edinburgh | Flanker | 8 | 13.8 | 0.4 | 96 % |
| Scott Penny | Leinster | Flanker | 12 | 13.3 | 0.4 | 89 % |
Despite Jac Morgan‘s first place, the tackle machine award goes to the 26-year-old Irish Number 8 Nick Timoney, who plays for Uslter. Timoney missed less tackles per game than Morgan (0.8 against 1.1) and played more games (18 against 13), hence being more consistent. He finished the season with 93% of tackles made, missing less than 1 per game, and scoring at least 15. Timoney was among the protagonists of another glorious season for Ulster which ended, however, once again, without silverware. For him only a couple of caps with Ireland so far, a number clearly destined to increase if performance were to remain at these levels. A third name to make is the one of the ever standing Hamish Watson, who closed the season at 96% tackle success. Bionic.

Turnovers
Turnovers are a work of art. It is a defensive gesture of extreme value that must be rewarded with its own special ranking. As done with the tackles, I calculated the number of turnover per game of each player who played at least 4 games in URC, and compiled the list of the five names with the highest scores.
| Player | Team | Role | Games played | Turnovers/game |
|---|---|---|---|---|
| Jac Morgan | Ospreys | Flanker | 13 | 1.8 |
| Deon Fourie | Stormers | Hooker | 16 | 1.7 |
| Toa Halafihi | Benetton | No. 8 | 8 | 1.6 |
| Jamie Ritchie | Edinburgh | Flanker | 6 | 1.5 |
| Uilisi Halaholo | Cardiff | Centre | 7 | 1.4 |
Also in this case, Jac Morgan ranks first. He did, however, play fewer games than Deon Fourie, the expert hooker who takes the cake due to the league victory with the DHL Stormers. A season to frame for Fourie, a 35-year old hooker playing for the Cape Town franchise, who recently got called-up by the Springboks for the first time in his life. Both Fourie and Morgan had at least 1.7 turnovers per game. Jac Morgan, in particular, proves to be an extremely well-rounded defender. The 22-year-old Welshman playing for the Ospreys surprisingly has only 3 caps with Wales to his credit, all in the 2022 Six Nations. Curiously, he didn’t play against Italy in the last match. If he had played, who knows, perhaps Capuozzo would never have reached the opponent’s five-meter line at the 78th minute. A third name coming off this chart is the one of Toa Halafihi. The 28-year-old New Zealander representing Italy has played 8 URC matches this year, sealing 1.6 turnovers per game. He also played 4 games in the Challenge Cup and 5 in the Six Nations, for a total of 17 games. A true cornerstone of both Benetton Treviso and Italy.
The best defensive team
For this statistic I aggregated the information by team, adding up the tackles per match of each player, the turnovers, and so on. I only considered the players who took the field at least once for their team, so as not to distort the averages with too many zeros.
| Club | Games/player | Tackles/game | Missed | Success | Turnovers/game | Penalties/game |
|---|---|---|---|---|---|---|
| Benetton | 8 | 121 | 17 | 88 % | 6 | 12 |
| Cardiff | 9 | 124 | 19 | 86 % | 7 | 11 |
| Cell-C Sharks | 9 | 104 | 14 | 84 % | 6 | 10 |
| Connacht | 9 | 136 | 20 | 85 % | 7 | 12 |
| DHL Stormers | 10 | 113 | 16 | 80 % | 7 | 9 |
| Dragons | 8 | 138 | 17 | 80 % | 6 | 13 |
| Edinburgh | 9 | 112 | 15 | 83 % | 8 | 10 |
| Emirates Lions | 9 | 110 | 15 | 85 % | 7 | 10 |
| Glasgow Warriors | 9 | 124 | 12 | 85 % | 6 | 10 |
| Leinster | 8 | 134 | 17 | 87 % | 6 | 10 |
| Munster | 7 | 114 | 15 | 87 % | 6 | 10 |
| Ospreys | 9 | 136 | 17 | 85 % | 7 | 9 |
| Scarlets | 8 | 142 | 22 | 85 % | 7 | 11 |
| Ulster | 10 | 146 | 14 | 91 % | 7 | 9 |
| Vodacom Bulls | 11 | 104 | 16 | 86 % | 6 | 11 |
| Zebre | 8 | 127 | 22 | 84 % | 7 | 11 |
Ulster made the highest numbers of tackles per game (146) while failing the least at it (91% success), and causing the least number of penalties (9). It is no surprise to see Ulster doing great in the regular season, and this is certainly due to the incredible defensive organisation that they display. Interestingly, the South African teams carried out a lower number of tackles per game when compared to European teams. The Bulls and Sharks close the rankings with 104, with Lions, and Stormers just above. South African teams tend to attack the breakdown, induce penalties, and confront opponents in the scrum, and are therefore tackling less times. Finally, this table should give faith to Benetton fans. Ulster was the team with the highest tackle success (91%), but Benetton Treviso comes in second place with 88%, ahead of Leinster and Munster (87%). If Treviso becomes more efficient in the offensive phase (we will see that later) they may have a shot at a higher position in the standings. Curiously, the DHL Stormers, who have grabbed the trophy, close the row of this statistic. As we just discussed, tackling is slightly less relevant in the South African way of playing the game. Hence, this success rate had a lower impact on the outcome of games for the Stormers. It was, however, their incredible offensive phase that led them to snatch the final trophy (see later). In conclusion, the best defensive team according to the considered statistics is Ulster, while the most effective defensive player was Jac Morgan from the Ospreys.

Offensive stats
I could not talk about defense only without going into the offensive statistics and try to put together the two sets of data into a single performance analysis. A team that defends perfectly but is unable to score tries won’t reach the higher part of the standings, and the same is true for the opposite. A team that can score tries but can’t defend is likely to be outgunned. Hence, let’s have a look at the abilities in offense of each player and each team in the URC.
Carries and gained metres
The gained metres represent the ability of a player to get the ball in a position x on the field and take it further to a position y. It is a fascinating statistic, which is a direct measurement of the impact of a player in the team’s advancing towards the try line. It is usually wings, centres and fullbacks who dominate this statistic due to their ability to break the defensive line and run off for 10-20 metres. Gained metres, however, are not enough to understand a player’s ability to make the team gain metres. They could in fact be the result of a couple of runs along the sideline inserted in an overall tasteless performance. I find the metres gained per carry to be way more informative, as they represent the average number of metres a players gains each time the ball is received. Let’s see who’s the best in the league.
| Player | Club | Role | Games played | Metres/game | Metres/carry |
|---|---|---|---|---|---|
| Grant Williams | Cell C Sharks | Scrum Half | 12 | 22.8 | 9.8 |
| Ruan Pienaar | Cell C Sharks | Scrum Half | 5 | 19.4 | 9.7 |
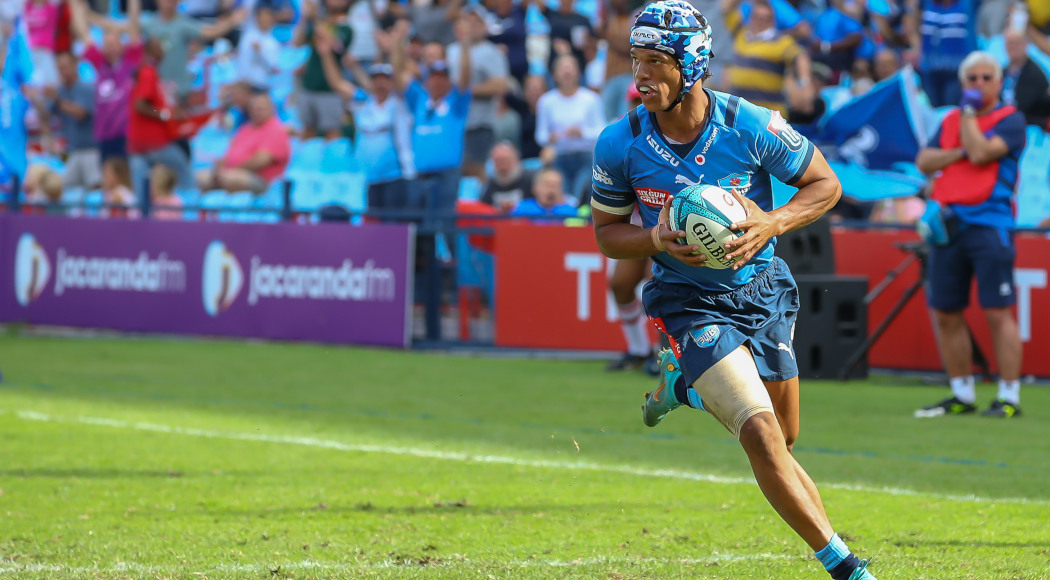
| Kurt Lee Arendse | Vodacom Bulls | Fullback | 14 | 77.6 | 9.0 |
| Sebastian Cancelliere | Glasgow Warriors | Wing | 7 | 58.0 | 9.0 |
| Quan Horn | Emirates Lions | Centre | 10 | 53.2 | 8.9 |
Among these, it is Kurt Lee Arendse who puts up a serious candidacy to win this particular prize, as he demonstrated also against my Benetton Treviso. Arendse gained an average of 77.6 metres per game, which distribute into 9 metres/carry. A lethal player when receiving the ball, able to pierce the defensive line and make his team advance almost every possession. An interesting data is also the fact that the two players with the highest metres/carry are the two Cell C Sharks scrum halves (9.8 e 9.7 metres/carry). The total gain/game is not comparable with the one of Arendse, but the fact that both play in the same team tells us something about the Cell C Sharks. In fact, it is easy to speculate that the Sharks may prefer to restart the game quickly after a foul forcing the defensive line to run back 10 metres. This is usually a task for the scrum half. Finally, the name of Sebastian Cancelliere comes up in this top 5 list. The Pumas did not call him up for this summer series of test matches against Scotland, which is strange considering that he plays in Scotland and that he is very effective in gaining metres each time he receives the ball. He is currently in the list of players called up by the Argentina XV, the second selection, together with Tomas Albornoz from Treviso. Interestingly, also Albornoz would be in this top 5 if we excluded wings and fullbacks.
Carries, tries and discipline
Another interesting statistic is the one defining how many carries each team does before being able to score a try. This statistic has to be taken with a grain of salt, especially when the kicking game is not considered, but it is nevertheless very indicative of a team’s ability to bring the ball past the try line effectively. From a different point of view, it is also an indication of how sterile the possession is for a team, when the number of carries/try is high.
| Club | Season games | Metres/game | Carries/try |
|---|---|---|---|
| Cell C Sharks | 19 | 344.9 | 29.2 |
| Leinster | 20 | 428.0 | 29.4 |
| Dhl Stormers | 21 | 362.9 | 30.2 |
| Scarlets | 18 | 348.9 | 30.8 |
| Vodacom Bulls | 21 | 362.1 | 31.0 |
| Munster | 20 | 313.4 | 31.7 |
| Benetton | 18 | 336.0 | 33.8 |
| Ospreys | 18 | 279.2 | 36.1 |
| Edinburgh | 19 | 387.6 | 39.8 |
| Emirates Lions | 18 | 311.4 | 40.6 |
| Glasgow Warriors | 19 | 340.4 | 41.2 |
| Ulster | 20 | 337.0 | 41.6 |
| Connacht | 18 | 362.3 | 41.8 |
| Cardiff Rugby | 18 | 336.9 | 50.9 |
| Dragons | 18 | 302.0 | 53.8 |
| Zebre Parma | 18 | 310.6 | 57.7 |
There are three groups of teams: ~30 carries/try, ~40 carries/try, ~50 carries/try. The two finalists of the URC are around 30, attesting to their offensive ability. In particular, I find Leinster to be the most lethal offensive team with 428 metres gained per game, 87 tries, 29.4 carries/try, and 634 scored points (not shown). I found Ulster’s score to be surprising (fifth from last) considering they reached the semifinals. It could also be indicative of the team’s attacking strategy, e.g. circling the ball among the forwards until a crack in the defensive line is found by kicking, but I don’t have details on that. Treviso also belongs to the “30” group with 33.8 carries/try, with 52 tries scored (only 5 less than Ulster). The reason why Ulster reached the semifinals and Treviso didn’t reach the playoffs likely lies in the discipline on the field. Treviso is among the worst teams in terms of penalties conceded (209 against Ulster’s 175). Putting together the metres gained, the carries/try, and the penalties conceded (not shown), the team that stands out is the Ospreys. They have gained a small number of metres/game (279.2). However, they are the team that conceded the least penalties (169) and in the top 3 teams that were less punished with yellow/red cards. Furthermore, they are the team that lost the least amount of turnovers (214). In the defensive data, the Ospreys showed a high number of tackles per game (136), with a good-enough success rate (85%), few penalties per game (9) and a good amount of turnovers won (7). Hence, while Leinster dominates the offensive stats, it is the Ospreys who surprise the most. They didn’t sow much but they reaped all of it.

Which team has more try scorers?
One last skill I want to take into consideration is how many players have scored a try for each team. Obviously, this is not an extremely robust statistic in defining a team’s ability to attack, but there is a certain correlation between a high number of try scorers and being multifaceted in the offensive phase. In fact, teams that only score with one approach may defeat many opponents in the regular season but are rarely the most successful teams of all. Diversification is the key to success. Here are the teams sorted by the number of players who went to the goal in the 2022/23 season.
| Club | Players in try | Tries | Points |
|---|---|---|---|
| Leinster | 33 | 87 | 581 |
| Munster | 29 | 69 | 345 |
| Cell C Sharks | 26 | 60 | 492 |
| Ulster | 26 | 57 | 447 |
| Scarlets | 25 | 63 | 417 |
| Benetton | 24 | 52 | 414 |
| Connacht | 24 | 49 | 375 |
| Glasgow Warriors | 23 | 53 | 359 |
| Zebre Parma | 21 | 29 | 227 |
| Vodacom Bulls | 20 | 73 | 513 |
| Dhl Stormers | 19 | 65 | 487 |
| Edinburgh | 19 | 57 | 397 |
| Cardiff Rugby | 18 | 39 | 195 |
| Ospreys | 18 | 46 | 232 |
| Dragons | 17 | 36 | 284 |
| Emirates Lions | 17 | 40 | 307 |
Dominating the top 5 of this ranking are three Irish teams, with the addition of the Sharks and Scarlets. The fact that many Irish teams are in the top 5 suggests an Irish approach to try-scoring based on a team effort rather than on a few groundbreaking actions from the usual suspects. Seeing Benetton is sixth in this ranking shows the variety of approaches that new head coach Marco Bortolami set up for the team in his first tenure year. Once again, the Ospreys rank towards the bottom. Not many people have scored a try around Swansea, but having won the Welsh Shield, it definitely paid off to direct the game through these few ones. The 33 players that scored a try for Leinster, the highest value of the league, show the versatility of the Dublin team, but are also the result of their great bench depth. The length of the Leinster bench poses another problem in the eyes of the public: the Dublin team does a lot of turnover and preserves their best talents for the games that really matter. This year, however, this strategy did not pay off. This great diversity of faces in the lineup every weekend has certainly given inexperienced players a lot of time while helping to strengthen what is the second battery of players on the team. At the same time, however, it is a strategy that has not paid off in full as the club has not taken home any silverware. I would not be surprised if Leo Cullen will give more minutes in the league to the most important players next year. In fact, here is a table with Leinster players who have at least 10 caps with a national team, and the number of games played in the league. Particularly striking are the few matches of Sexton and Furlong.
| Player | Games_played | Games_started | Caps |
|---|---|---|---|
| Cian Healy | 11 | 3 | 116 |
| Johnny Sexton | 4 | 2 | 111 |
| Sean Cronin | 11 | 4 | 72 |
| Devin Toner | 11 | 6 | 70 |
| Tadhg Furlong | 6 | 4 | 64 |
| Robbie Henshaw | 5 | 4 | 61 |
| Andrew Porter | 7 | 5 | 43 |
| James Ryan | 5 | 4 | 42 |
| Garry Ringrose | 8 | 7 | 42 |
| Josh Van Der Flier | 8 | 6 | 40 |
| Jack Conan | 5 | 4 | 31 |
| Jordan Larmour | 9 | 8 | 30 |
| Rhys Ruddock | 16 | 12 | 27 |
| Dave Kearney | 4 | 3 | 19 |
| Hugo Keenan | 6 | 6 | 19 |
| Luke Mcgrath | 16 | 10 | 19 |
| Jamison Gibson Park | 7 | 4 | 17 |
| Ronan Kelleher | 4 | 2 | 17 |
| Caelan Doris | 7 | 6 | 16 |
| Ross Byrne | 16 | 12 | 13 |
| James Lowe | 6 | 5 | 12 |
| Dan Leavy | 7 | 4 | 11 |
In conclusion: who’s got the best of both worlds?
We’ve seen how good Ulster was in defense, and how good Leinster was in offense. Both teams behaved very well in both phases of the game. Leinster could score a try with 33 different players, scored a riveting 581 points, but at the same time scored 134 tackles/game with a success rate of 87%, conceding only 10 penalties/game. Ulster scored with 26 different men, bringing 447 points home, while defensively they scored 146 tackles/game with a success rate of 91%, conceding only 9 penalties/game. The average number of games played by each Leinster player was 8, while for Ulster it was 10, a sign that indicates the difference in bench length between these two teams. Both Leinster and Ulster reached the semi-final of the URC, losing to the Bulls and to the Stormers, respectively. In both cases, the loss happened by less than 3 points. Taking a look at these two South-African sides, the Stormers scored a try with 19 men, but scored 487 points, 40 more than Ulster, which were the result of 65 tries instead of the 57 that Ulster scored. Hence, the Stormers relied on a smaller unit of athletes capable of bringing the ball beyond the line, showing less versatility but more efficiency. The Bulls have similar numbers, having scored 73 tries with 20 men for a total of 513 points. Defensively, the Bulls showed good tackle success (86%) while the Stormers did not (80%). The Stormers were, however, much more disciplined having conceded only 9 penalties/game against the 11 conceded by the Bulls. Looking at the values produced by these four teams altogether, it was really hard to make a choice. Therefore, I decided to take a look at the ranking of each team in each statistic, which is available here. The feeling I got, after scrolling the team statistics, is that Leinster was the best all-around team, with Ulster being the best defense. The two South African teams (Stormers and Bulls) that played the final of the URC appeared less competitive when looking at the numbers. But they won, you may say, and you’d be right: sport is not an exact science, and looking at statistics only tells part of the story. Clutch also counts, as well as the ability to win certain key games. Leinster failed at the latter this year, twice, losing to the Bulls in the semifinals and to La Rochelle in the Champions Cup final. Would they lose a series against La Rochelle or against the Bulls? Likely not. Hence, I feel like the best all-around team for this season has to be Leinster. Here is the complete list of team awards:
| Award | Team |
|---|---|
| Best all-around team | Leinster |
| Best defensive team | Ulster |
| Best offensive team | Leinster |
| Best clutch team | Stormers |

2 pensieri riguardo “URC defenses and attacks: who’s got the best of both worlds?”